Introduction
In Essbase user’s world how a
number is computed by the engine was a mystery all these years. In some simple
to moderate cases it was possible to understand how and why a number was
derived that way, but the more complicated the model the harder it was to
understand what it is doing. This is not so surprising considering the nature
of multi-dimensional modeling. Database designers used to wonder why is this
number this instead of what they thought it would be. Sometimes they used to
get surprised to see that nothing was calculated at all and it is returning
#Missing. So every one used to call this “black magic” and did experiments to
derive certain behaviors and blogged about it. The correct modeling was
completed through trial and error or you can say try and cry if you want to be
funny.
The Essbase team understood this
and wanted to change this. We want to make this easy for the user. We
introduced this feature called calculation tracing that will help you
understand how a particular number was derived or why it was not calculated at
all and is still #Missing.
Let me walk you through how you
can use this. I am going to represent our model through our new innovation called
the DBX workbook.
The Model
Let us say you have model with
three dimensions Calendar, Product and Measures. They are shown below.


Now I loaded some data into ShippedUnits
for products P1-a1, P1-a2, P1-a3, P1-a4
for FY19 months (FY19-Jan, FY19-Feb so on and so forth). Similarly for P2-bx
combinations and P3-cx combinations.
I also loaded ParentForecastUnits
for P1-Clone, P2-Clone, P3-Clone for both FY19 months and FY20 months.
The calculation scrips
Now I wrote two calculation scripts one called shipped_percent.csc

And the next one called
forecast.csc

Test and validate the numbers
Now I went to smart view and
created the following query sheet. Note “-“ are all #Missing in these pictures.

Examine the query sheet. Products are listed in column A. P1-a1
and P1-clone are products. As you can see if you look at the Dim.Products
sheet, both are children of P1, a product category.
Measures are named in column B of the query sheet. You can see details about them on the Dim.Measures sheet; for example, notice that ShippedPercentage and ParentForecastUnits do not consolidate.
Columns C:G on the query sheet are for fiscal year 2019, and columns H:L are for fiscal year 2020. In this exercise, assume we are in FY2019, trying to forecast for FY2020.
In C2:E2, data exists for units shipped in the first quarter of FY2019. Based on those initial numbers, we’ll do two calculations:
a) C3:E3: the percentage of total shipped units (C10:E10) that is attributable to P1-a1 (for example, we expect that C3=C2/C10, or about 40%)
b) H5:J5 -- a shipped-units forecast for the same quarter a year later. The allocations for FY2020 are based on the Shipped Percentage for the same product in FY2019. For example, we expect that H5=H8*C3, or about 18,261
Now Go to the Essbase ribbon,
click Calculate, and run the shipped_percent calculation. Then run the
forecast calculation also. Refresh the sheet. I am surprised. Cell C3 is not
what I thought it would be. Its #Missing.
CALCTRACE to the rescue
Alright, let me see how I can use
Calculation tracing to get some help. I went to the application configuration,
and added a configuration setting CALCTRACE TRUE. Restarted the application.
Then came back to query sheet and
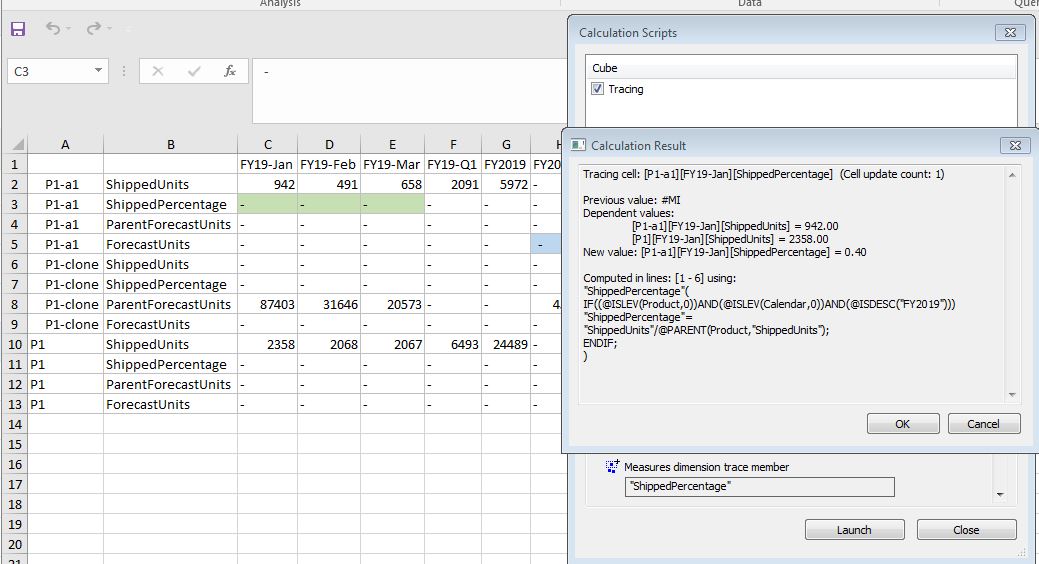
reconnected. Now I kept my mouse on cell C3 and ran shipped_precent
calculation. Now the output shows me what happened.

Essbase displays the calculation
tracing information, which shows you that cell C3 was not affected by the
calculation. This usually means the cell is not in the calculation’s scope.
Errors pertaining to scope often mean that you need to debug a FIX or IF
statement.
I looked at my
shipped_percent.csc. Ah! I got it. The error is in the IF statement. For a
historical allocation for Jan-2019 to be in scope, the IF statement should
reference 2019, not 2020. Correct, validate, and save the calculation.
Re-run the shipped percentage
calculation, from cell C3, to compute C3:E3. Tracing information displays,
showing you the effect the calculation had on C3. Refresh the sheet. The
numbers should change for C3:E3 (C3 is approximately 0.399 or about 40%).

Execute the forecast script to
get the right numbers for H5:J5 (Hint: H5 should be about 18,261).

To turn off calculation tracing
when you don’t need it anymore, return to Essbase in your web browser. Select
the application, launch the inspector, and click Configuration. Double
click the ON value next to the CALCTRACE property, change it to OFF, and click Apply
and Restart.
Conclusion
As you can see Calculation trace
clearly helps with understanding a lot more about what is happening inside the
Essbase engine.
Currently CALCTRACE should only
be reliably used in application development phase. Meaning only one user should
be running calculations on this database while you have this enabled for this
to reliably show you what happened.
If you liked it, let us know. If
you want to see more capabilities from this feature, let us know as well.